No manual programming of complex rules and algorithms
In automation, the use of machine learning is becoming increasingly widespread, with the application often focusing on already familiar subject areas: Condition Monitoring (CM) and Predictive Maintenance (PM). In a use case, data from normal plant operation is used to learn a model that, compared with live data, indicates anomalies and indicates wear.
Data-based condition monitoring and predictive maintenance of machines and plants has been taking place for years. These measures are always aimed at increasing overall effectiveness and avoiding production downtimes and quality reduction. Currently, expert systems are used in the majority of cases, where the user sets alarm thresholds for certain operating parameters or generates maintenance plans for the components based on operating hours. Due to the constantly increasing complexity, however, the design and efficient configuration of such systems is proving increasingly difficult. In addition, maintenance today should no longer be carried out according to a predefined plan, but rather according to demand.
But the ever-increasing complexity and networking of machines in the context of Industry 4.0 also brings advantages: data. The data of the sensors, actuators and process parameters, which are needed to control the process anyway, are available for further use and now form the basis for ML technologies. In this way, data from normal plant operation can be used to learn a model that can be compared with their live data. If deviations from the model occur, this indicates, for example, anomalies in the production process or indicates wear. In addition, it is possible to label special error patterns in the learning data so that they can be detected early on. This approach eliminates the need for manual programming of complex rules and algorithms. In the following, a use case for anomaly detection by a specific model – a hybrid time-based machine on a production machine – is explained.
Cloud-based learning of a model of normal behavior
The production machine in this Use Case is the so-called “Individual Laser Engraving Unit”, or ILE for short. The machine is used for demonstration purposes for individual laser marking of different products in batch size 1. With the exception of the insertion and removal of the products, it is fully automatic. A programmable logic controller (PLC) is used to automate the production process. It controls a series of drives for handling the products, the laser unit for marking and various other sensors and actuators via the Profinet RT real-time field bus system. The sensors include an energy measuring device that records the energy requirements of the entire system. The fieldbus system runs with a cycle time of 100 milliseconds. The main controller uses a state machine with individual step chains for the different product types and the reference run. The energy consumption of each production step is available due to the energy measurement, which takes place synchronously with the production process via field bus system.
In order to detect deviations from the normal production process, a model of normal behavior is to be learned from the generated data. Since the PLC is mainly responsible for controlling the process, the model is learned and anomalies are detected in Proficloud, the cloud system from Phoenix Contact. For secure data transfer to the cloud, another controller, which acts as an edge device, is connected as a Profinet device. The current process step and the associated energy consumption can be forwarded via the process data. The Edge controller samples the data with the same cycle time as the fieldbus system and sends it in blocks to the cloud via a data diode. Figure 1 shows the corresponding block diagram. In the cloud, the data is stored as time series and the model is learned from historical data. The anomaly detection with the learned model is then based on the live data of the ILE. A web dashboard displays the results. Because the manufacturing process is already programmed as a state machine in engineering, the use of hybrid time-based machines as a model for anomaly detection is a good idea.
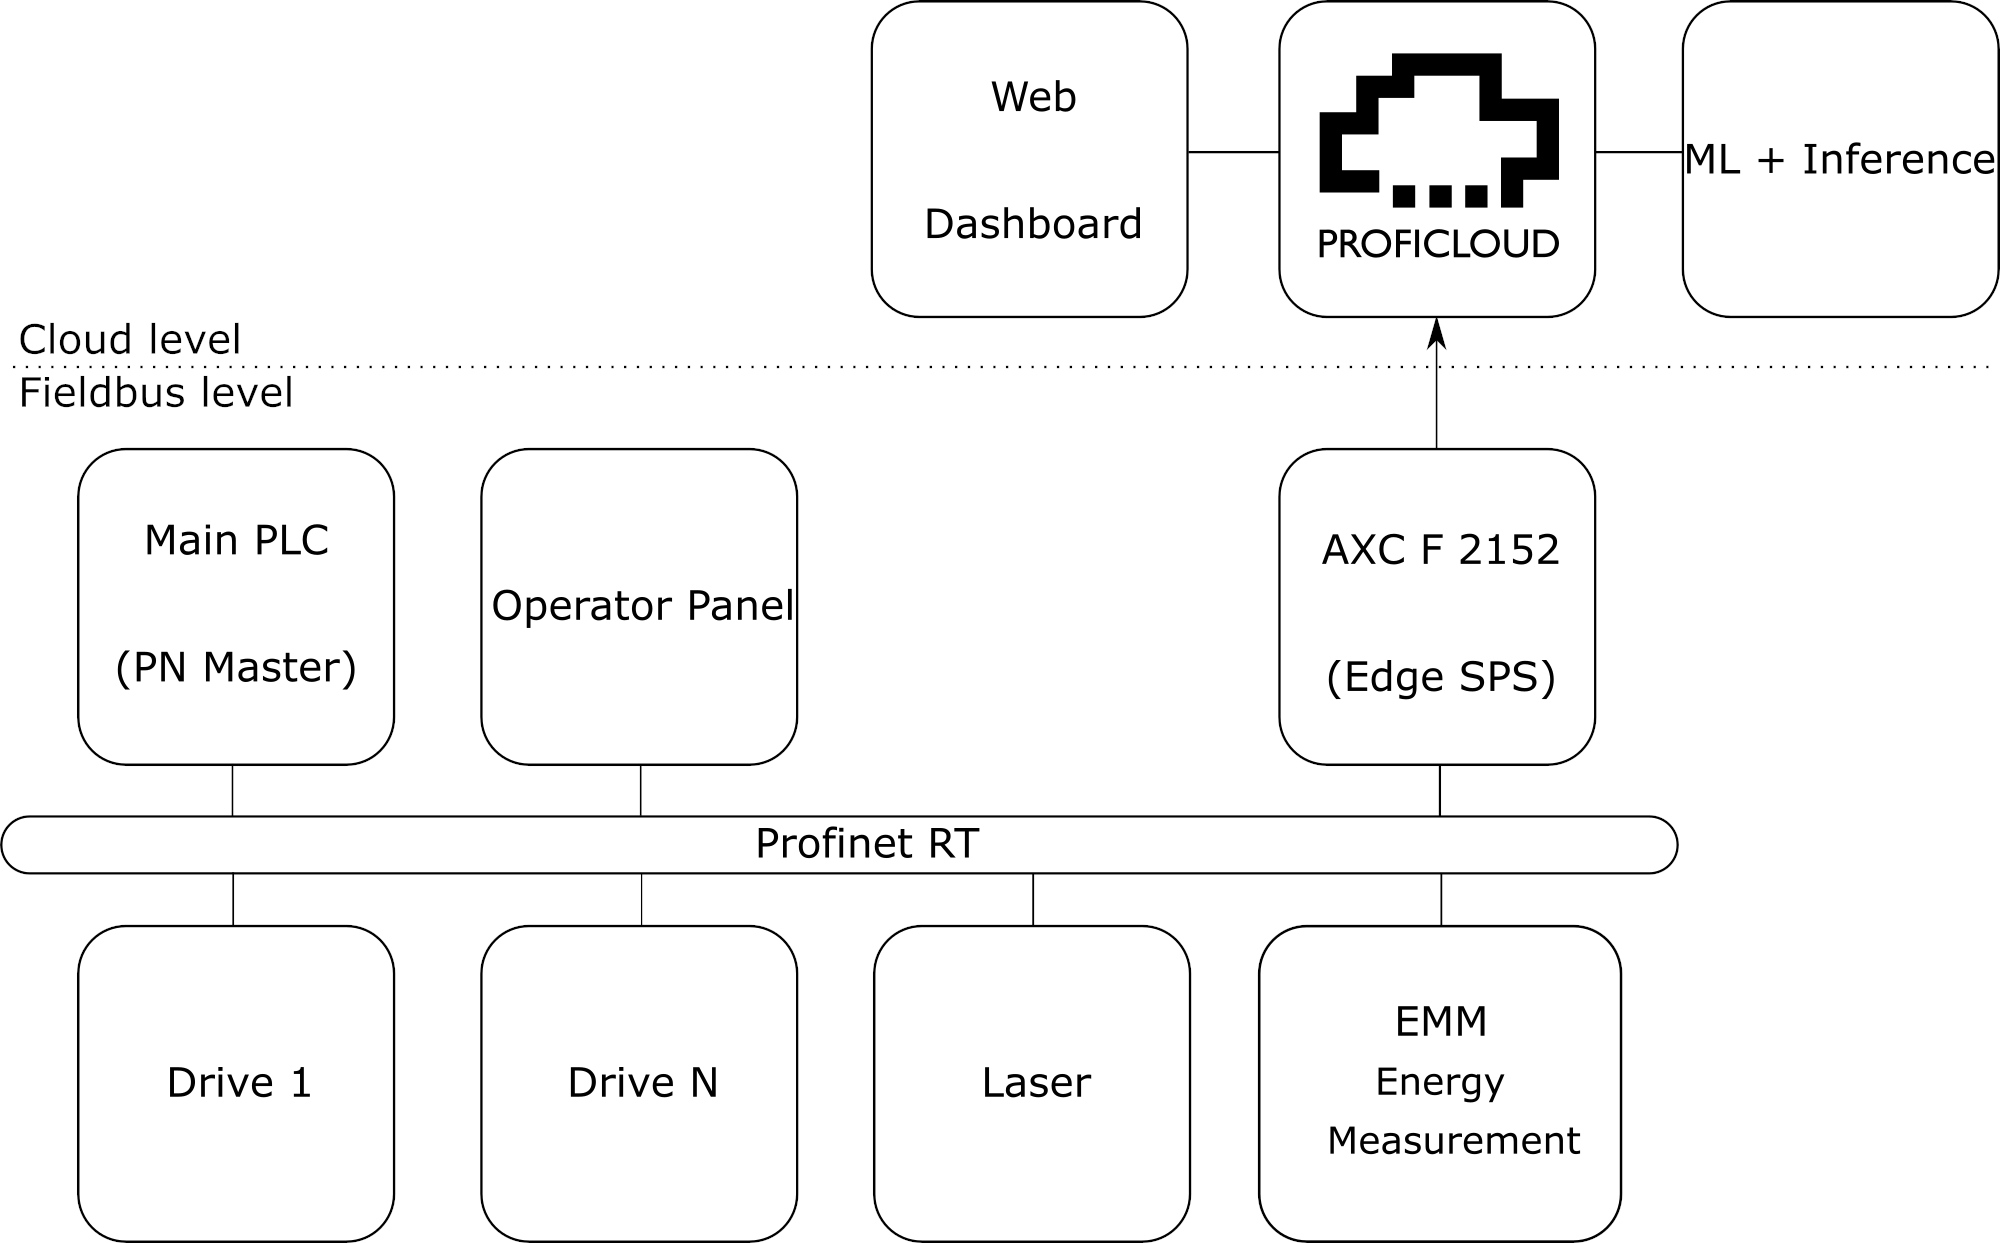
Figure 1: Block diagram of the Use Case. The connection to the cloud is established via a data diode
Special monitoring of energy consumption and transitions between production steps
In the use case described, the energy consumption depending on the production step and the transitions between the individual production steps are to be monitored in particular. Hybrid time-based automata are suitable for modelling here, as they are very similar to the state machines from engineering. The term “hybrid” refers to the differentiation of different signal and data types. The transitions between the states in the automaton are triggered by discrete events – for example binary switching signals. A separate model depicts continuous or real-valued signals – such as power consumption or temperatures – within a state. Figure 2 shows a simple example with two states.
In principle, the automata consist of several components: A discrete, time-dependent automaton takes over the modeling of the respective states and the transition between the states including the time behavior. Within the different states the continuous behaviour is learned with a wider model. Which model formalism is used within the states is completely independent of the discrete state machine.
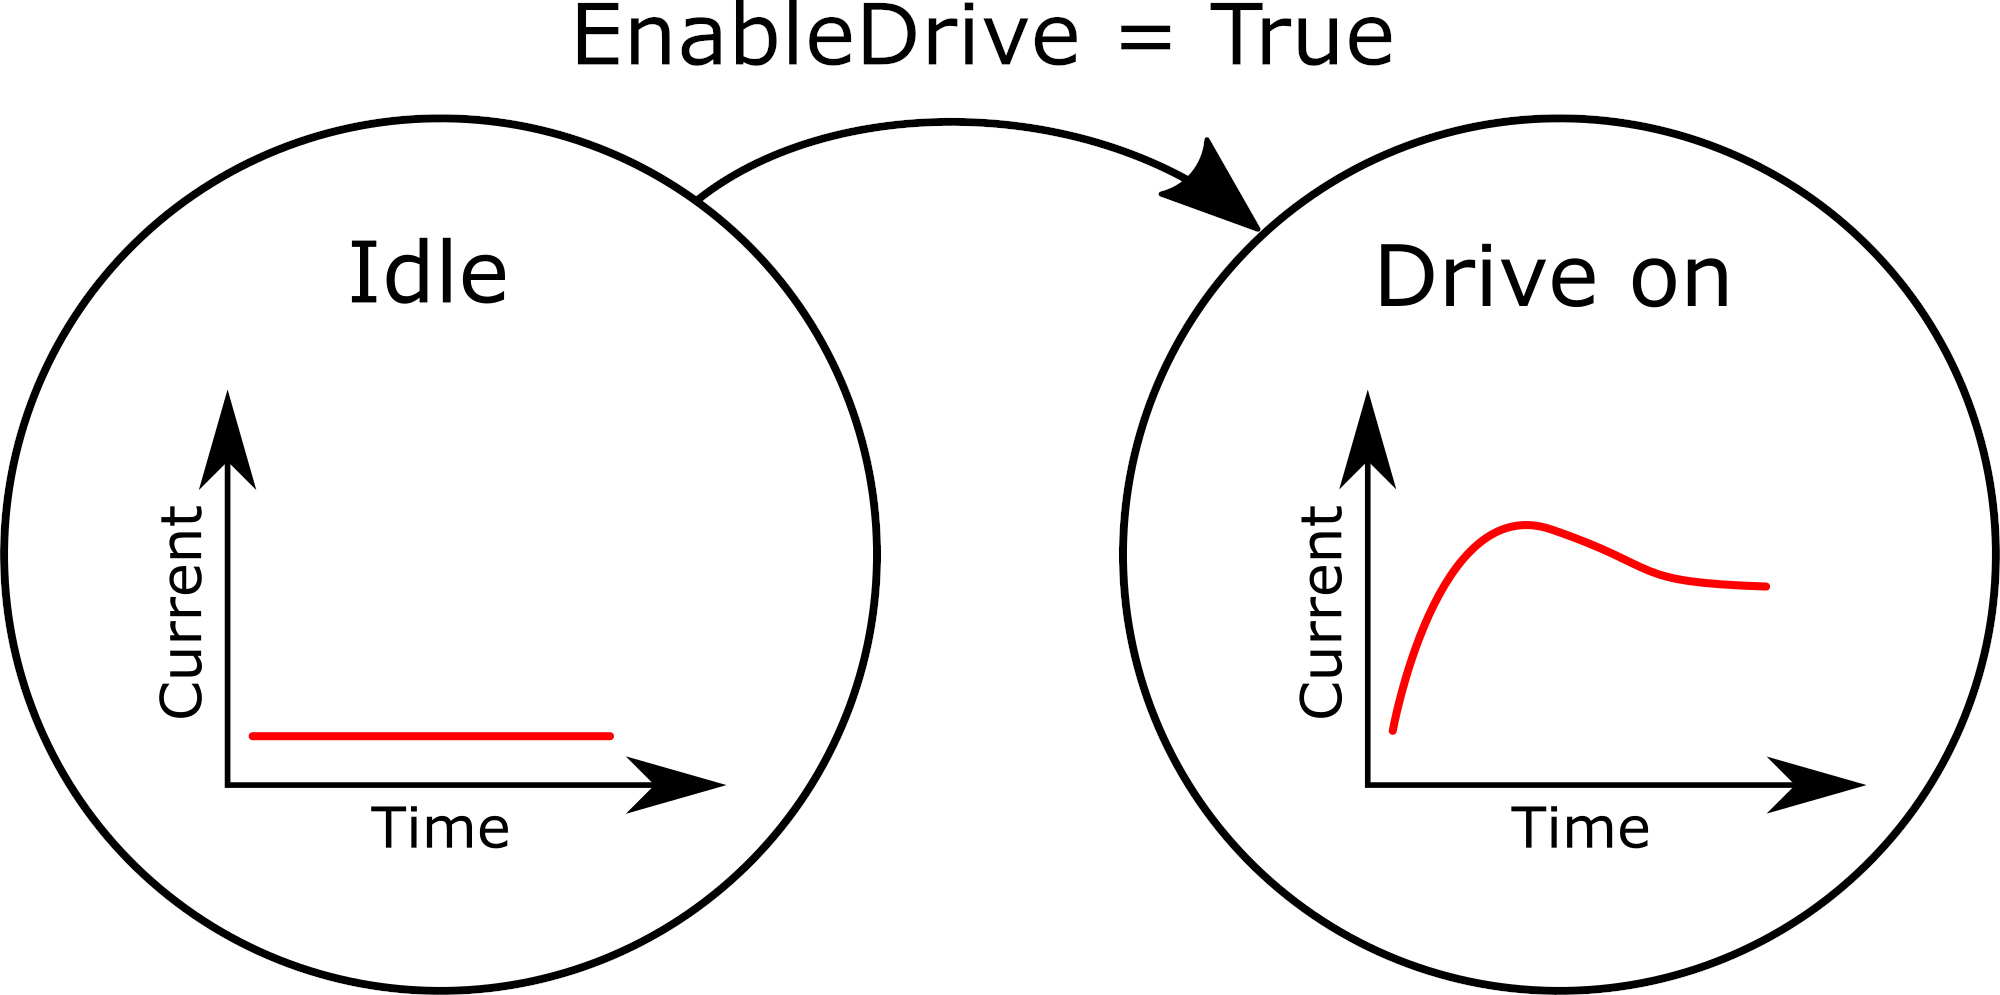
Figure 2: Example of a hybrid automaton using a switch-on process
Individual assessment of the anomalies by experts
There are different algorithms for learning such automata. In the presented Use Case, a modified form of OTALA[1] is used, in which the automaton is not learned online, but on historical data. In the Use Case described, the user has direct access to the variables of the state machine in the PLC. The changes of these state variables can be used immediately, because each value corresponds to a defined state or process step. The algorithm learns the occurring states and the possible transitions between the states. Potential times are also learned for each transition. Within the states, relative times are used. If the state changes, the relative time is set to 0. If the state changes again, the minimum and maximum time for the transition is calculated based on the relative time. Within the states a model of the continuous signals can be learned, whereby the model within the states can be arbitrarily complex.
The learned state machine reflects the normal behaviour of the plant and is suitable for detecting anomalies. This works similar to the actual learning process, but no adjustments are made to the automaton. The state machine model follows the new incoming data, compares the states, transitions and timings and performs the inference with the continuous state model. Different types of anomalies can be detected:
– An unknown transition is detected when a change between two states occurs that are not connected by a transition.
– If a transition occurs in a completely unknown state, this is also detected.
– A time anomaly can be identified when a state change occurs but the learned timing is not kept.
– Finally, the continuous anomaly remains, the generation of which takes place within the states depending on the model.
The state machines explained here have an additional advantage: They can be read by humans and at least the discrete part can be extended. If an anomaly is often detected at one of the transitions, which the expert evaluates as harmless or normal, the time span of the transition can be edited. If a state or process step is very variable in its length, or if it includes manipulations by a person who is not working to the millisecond, the state can be marked as accepting. In an accepting state, no anomaly will be triggered if the transition lasts too long.
Efficient design of maintenance
Due to the connection of the machine to the cloud, the resulting data can be saved automatically. The model was learned based on two days of historical data from the verified, normal operation of the machine. The model was also learned in the cloud. Figure 3 shows the energy consumption and process steps in a single production cycle. The type of product can also be identified from the process steps: A value between 1000 and 1999 describes a product, between 2000 and 2999 and between 3000 and 3999 another product. A value between 4000 and 4999 marks a reference run. The Auto¬mat can be read by humans as a learned model. The different product types and the reference run can be recognized exactly in the learned model.
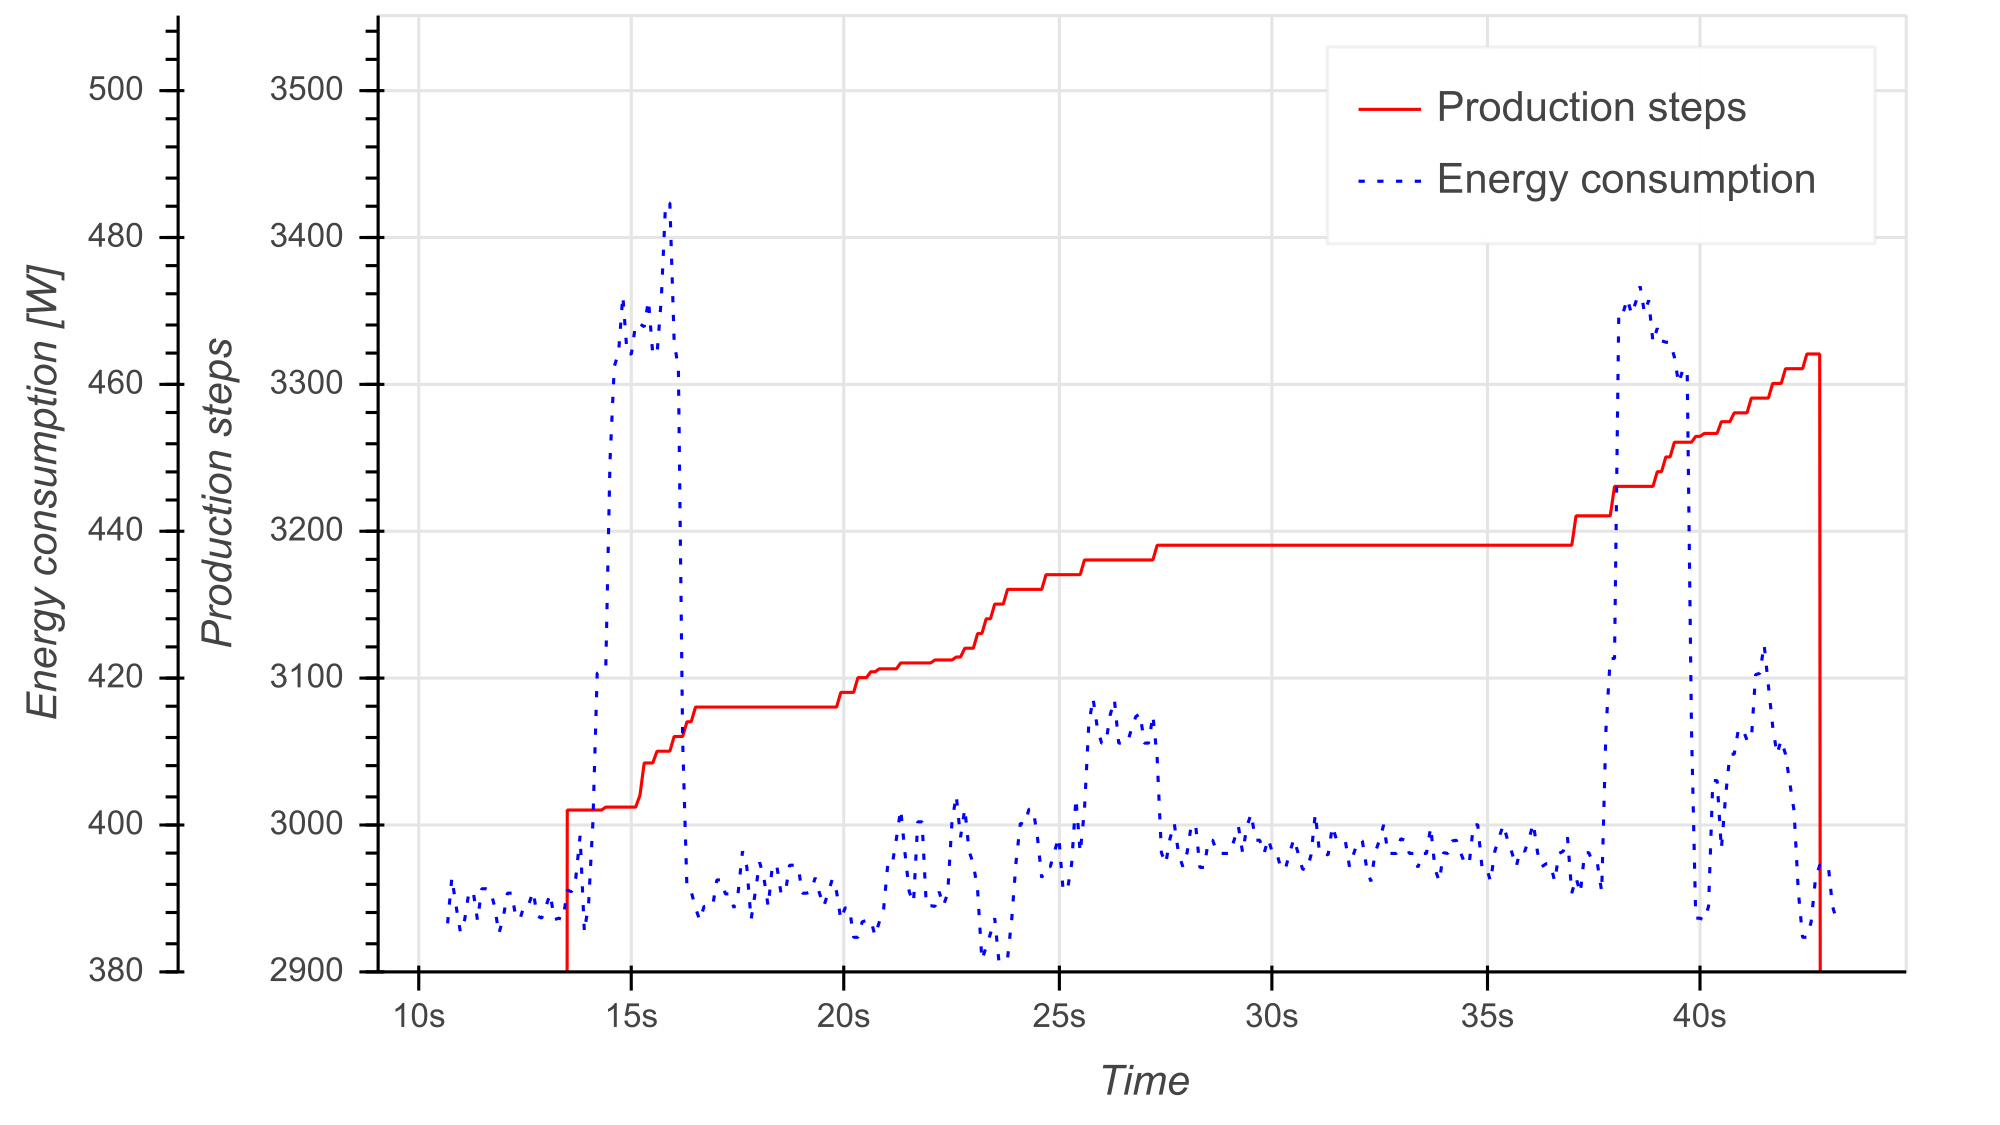
Figure 3: Production steps and energy consumption in a production cycle
Since the learned automaton contains 113 states, Figure 4 shows an abbreviated version. Furthermore, the learned model is supplemented by expert knowledge. Some states vary greatly in their time behavior. These include the insertion and removal of the products by the machine operator and the duration of the labeling process, because this depends on the length of the labeling. The corresponding states are marked as accepting by the expert in order not to generate unnecessary anomalies.
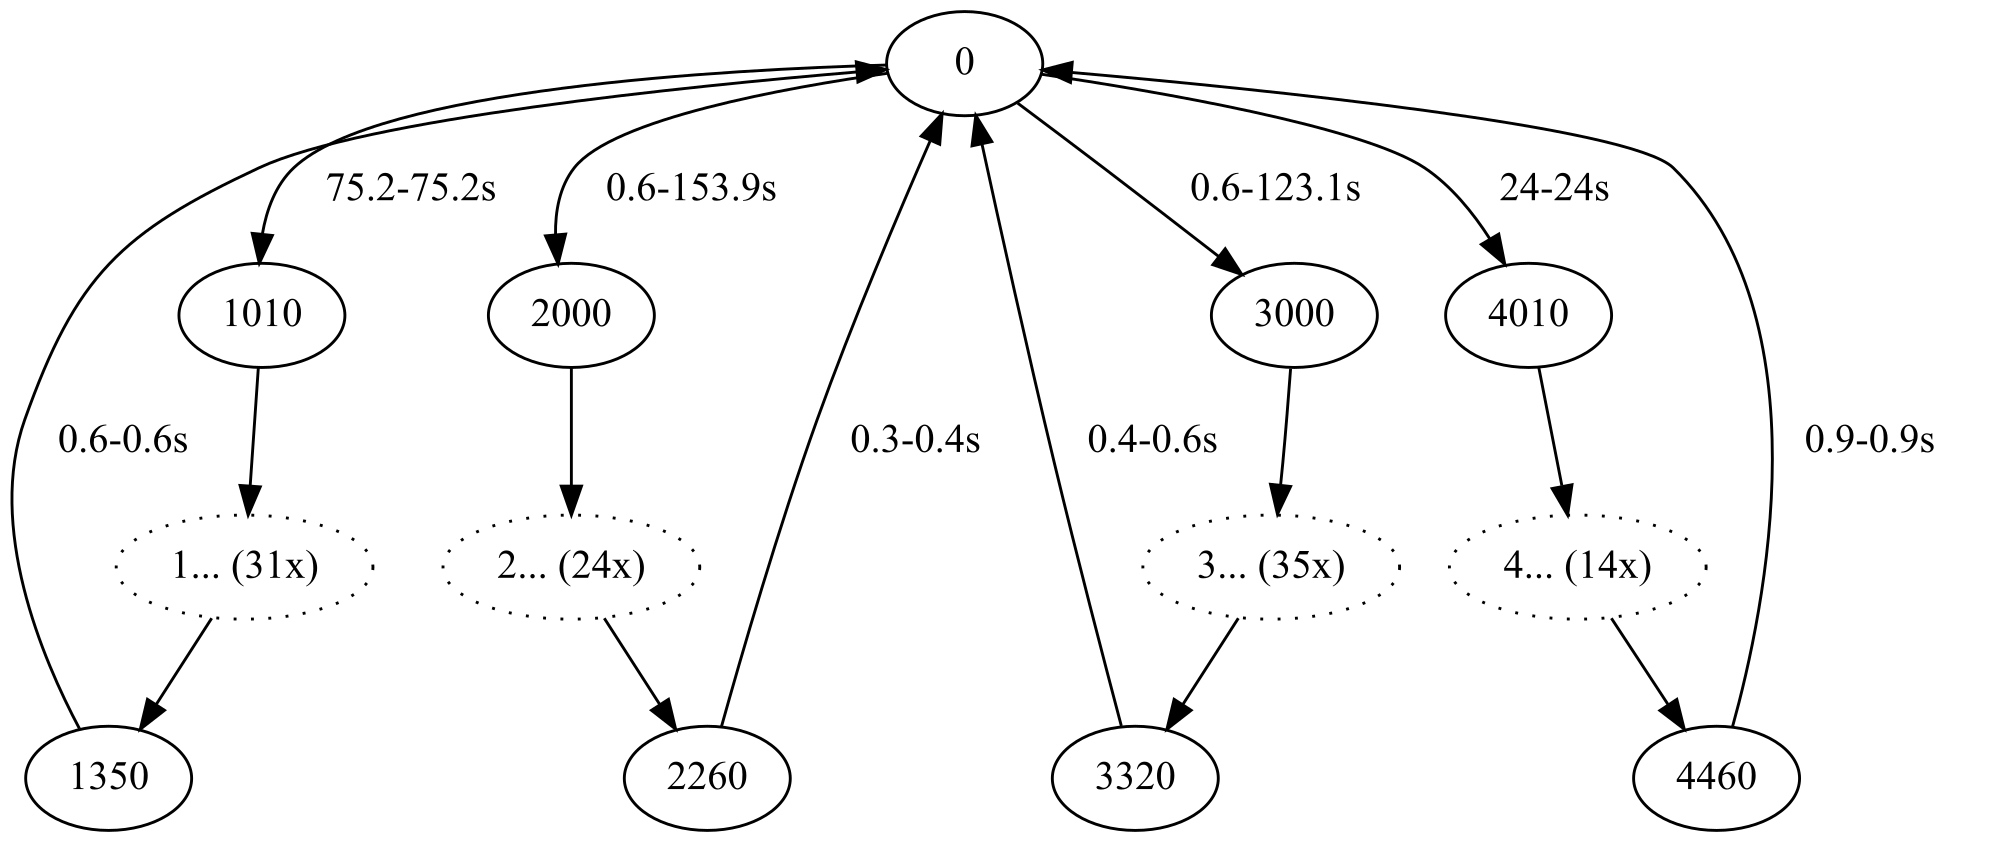
Figure 4: Shortened version of the final learned automaton with recognizable branches for the three different product types and the reference run
To perform anomaly detection, the learned model is available as a separate micro-service in the cloud. The live data from the machine is compared with the model and the detected anomalies are displayed to the operator on a web dashboard. The operator’s expert knowledge of the manufacturing process allows him to interpret the detected anomalies and react appropriately. Deviations from the learned time behavior provide an indication of changed production parameters or drift in the machine adjustment. Increased energy consumption can be attributed to sluggishness or wear of a drive, for example. By clearly assigning energy consumption to the process step, the cause of the anomaly can be limited to the drives working in the process step, so that maintenance is efficient.
[1] Maier, Alexander: Identification of timed behavior models for diagnosis in production systems, 2015

