For data-driven decisions, small and medium-sized companies do not need large investments in hard- or software. A straightforward cloud approach is sufficient to collect and evaluate machine data and draw the right conclusions with the help of modern monitoring.
Around 2013, the slightly worn-out buzzword “Big Data” promised the efficient processing of unmanageable, complex and rapidly changing amounts of data. The approach was supposed to make connections and causal chains in all areas of business visible and predictable. Companies hoped for better competitive advantages and new business models. Unfortunately, not all parts of that vision came true because larger amounts of data do not necessarily mean better quality data. In addition, many small and medium-sized companies are still not making optimal use of the potential that analysed data volumes could offer. Nevertheless, the basic idea of “Big Data” remains: Using digital technologies to filter usable knowledge from data that would otherwise not be used. This opens up new, unprecedented opportunities for small and medium-sized companies in particular.
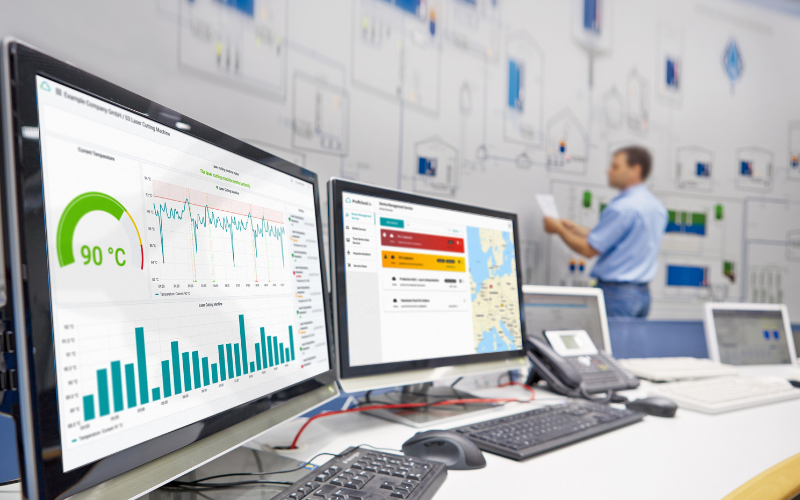
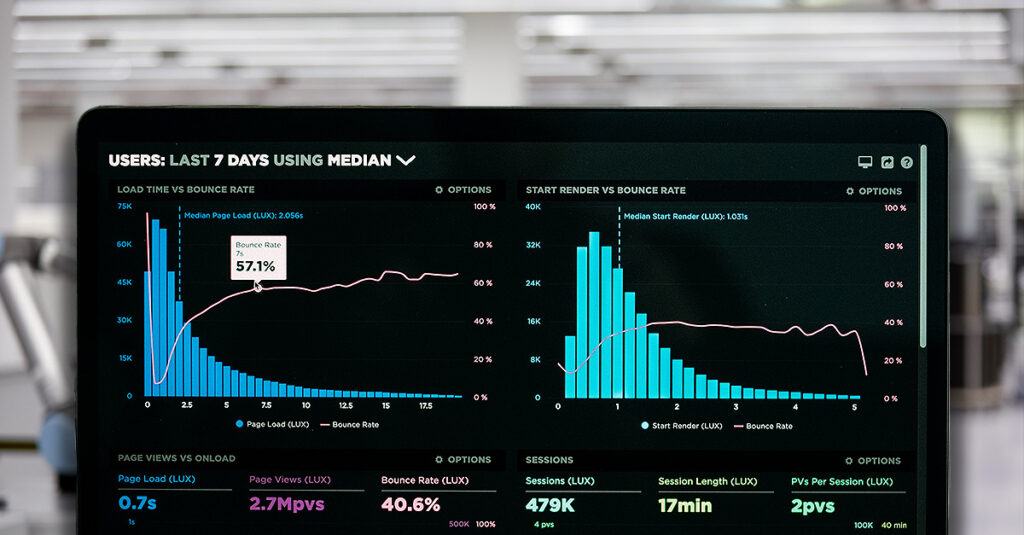
Modern monitoring collects filtered information in a central location. In a so-called “monitoring dashboard”, users can design and continuously configure the presentation and analysis of their own data according to their needs. True to the motto “the bigger the better”, the focus shouldn´t be on the quantitative amount of data but rather on a manageable effort with which real added value could easily be generated. Process data from machine and plant operation has particularly promising potential because every industrial machine generates a lot of data in its daily life. This data can be useful for the following scenarios:
- By determining process data, a fundamental basic knowledge is created. What exactly is happening in the plant and what are the current conditions of the machine. This knowledge can be used to draw conclusions and make decisions.
- To ensure that the utilisation of the plant is as efficient as possible, the collected process data can help to optimise different parameters of the machines. This reduces downtime and improves the quality of the products.
- In terms of sustainability, monitoring can help to use the recorded data for savings purposes. From the process data, it can be read whether a machine is continuously utilised or not. This makes it possible to save energy and material and helps to get more and more sustainable.

In many companies, machine data remains in the manufacturing plant and is not used further. Only machine operators interpret and use the data in a rudimentary way. So, it is the individual know-how and experience of the user that is decisive. Other companies collect their data but do not evaluate it systematically and continuously, so important learnings are only available temporarily.
This is where modern monitoring comes in. Because centralized and filtered real-time information can help monitor production, facilitate services and maintenance, and reduce downtime. In addition, the data is displayed by simple visualizations that have been configured specifically for the user needs. “Adieu” to confusing dashboards with a jumble of numbers and cryptic characters.
Easy access with few resources
So how do small and medium-sized companies manage to set up a central view of their process data and thus remote monitoring across locations? And how can they subsequently use the existing data potential to benefit from the possibilities of the Industrial Internet of Things (IIOT)?
This can be clarified with the example of Time-Series-Data. They are a sorted collection of metrics that arise in every company that operates machines. It´s important that data are collected at regular intervals.
For permanent data transmission, the machines must first be networked with each other. This works best with an industrial IoT-Cloud because a cloud solution is particularly suitable for small and medium-sized companies with limited IT resources. The needed software is available immediately and comes without maintenance requirements thanks to a software-as-a-service model. This allows starting with few resources and without complex system integration.

Individual configuration for an optimal workflow
The web-based dashboards of a Time-Series-Data-Service are easy to configure, even without special IT knowledge. The monitoring dashboard displays the recorded parameters clearly in individual diagrams. For example, as a bar chart, heatmap or as a simple list view. This allows data such as motor temperature, speed, flow rates, energy consumption or connection rates to be clearly displayed.
Good to know: With modern monitoring, previously defined limit values can be monitored with the help of an alerting feature! If a customizable threshold is exceeded, e.g. if the temperature of a machine rises above 90°C, the Time-Series-Data-Service automatically informs the user of this fault. In the medium term, this can become a proactive approach because data evaluations make operation and maintenance more predictable, and enables the development of the best possible workflow.
Example: How it could work
There are several ways to enable connectivity to a data analytics cloud. For example, hardware components such as PLC, gateway and energy meter are needed. Already existing hardware can be connected with new gateways. This hardware can establish a direct connection to the cloud and transmit the accruing data.
There are basically two ways to introduce an analysis tool such as the Time-Series-Data-Service:
- A data manager is appointed who, in a first step, analyses the incoming data and determines which data should be used for monitoring and which should not.
- A small test balloon is launched in which a selected department connects individual machines to the cloud and begins to collect data and make deductions.
Conclusion
The possibilities of modern monitoring and a Time-Series-Data-Service seem almost unlimited. And all this for a manageable time investment! True to the motto “think big, start small”, the best way to get started with monitoring seems to be a test balloon. In this way, companies learn step by step which metrics are important for them and from which data which conclusions can be drawn.


